
Ungava Bay Iron Deposits
Overview
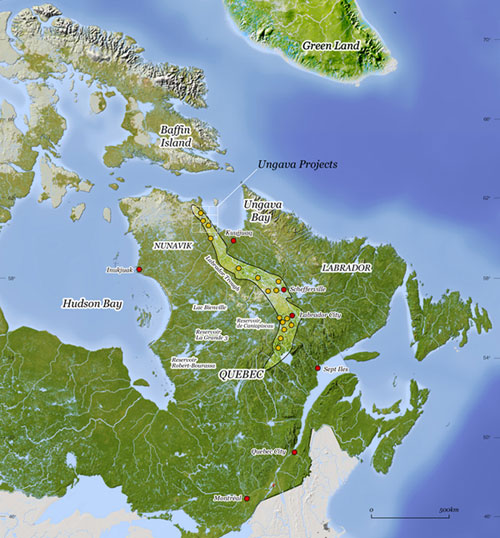
Oceanic is focused on the development of the Ungava Bay iron properties. These properties comprise more than 3,000 claims over three project areas, namely Hopes Advance, Morgan Lake and Roberts Lake, which are located over approximately 1,500 km2 along the northern extension of the Labrador Trough in the Nunavik Region of northern Quebec. The projects cover over 300 kilometres of iron formation and all the deposits are located within 20 – 50 km of tidewater.
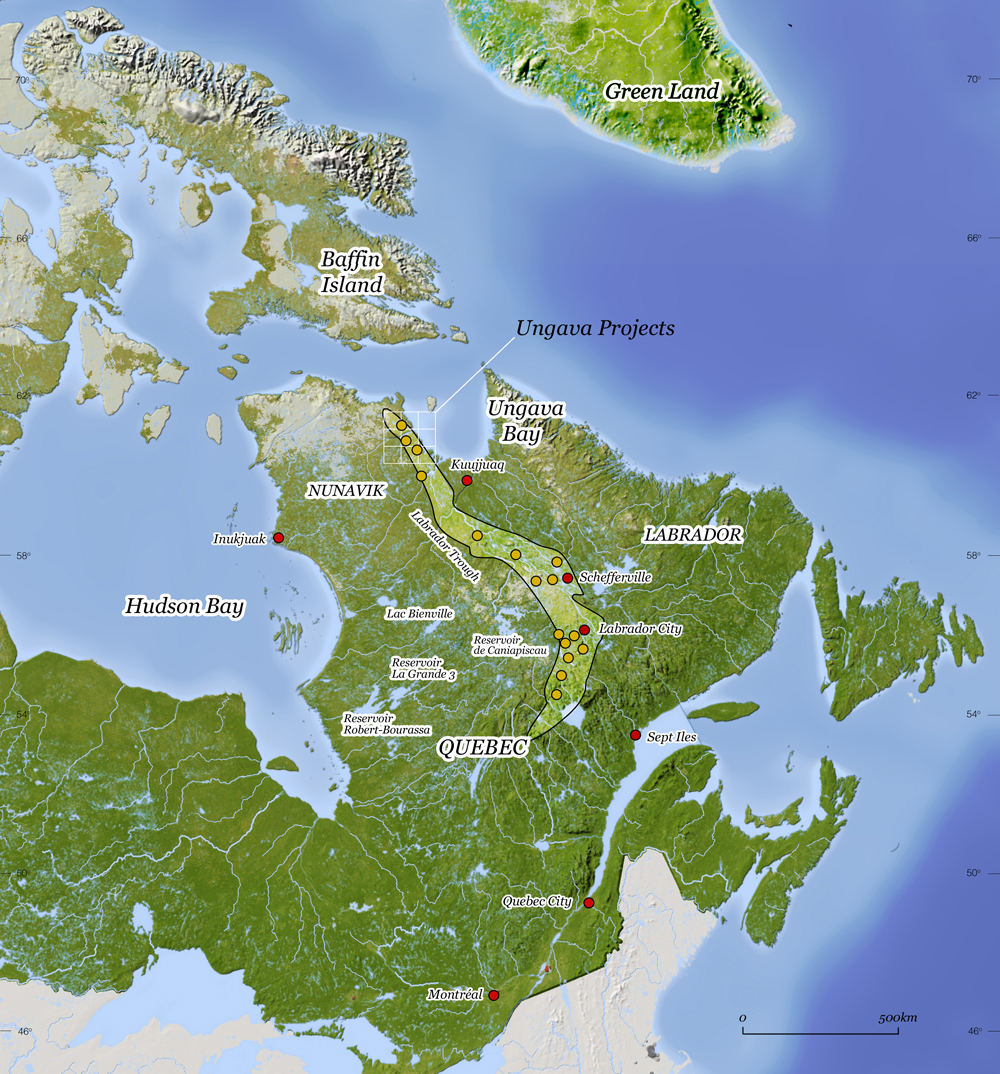 Figure 1. Location Map. |
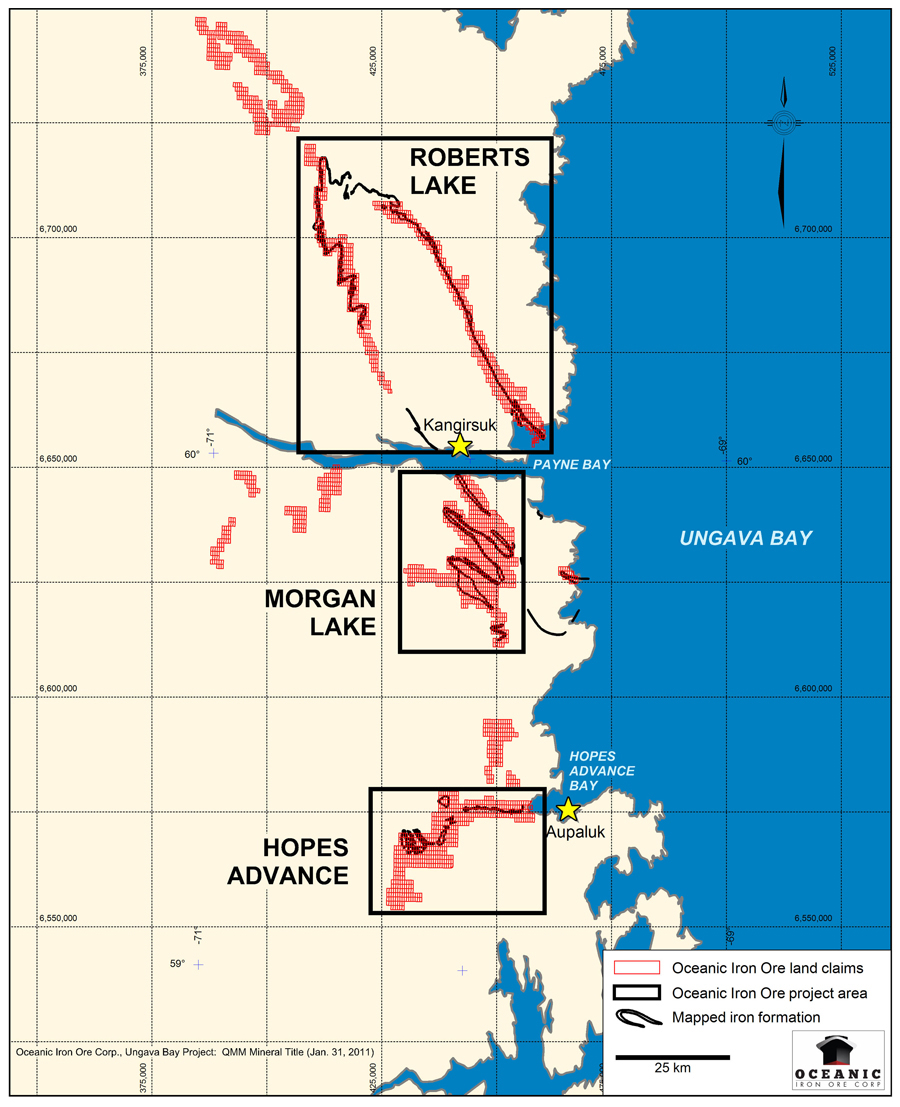 Figure 2. Project Location Map. |
All three project areas have been explored historically in the 1950's and 1960's, including sampling, drilling and metallurgical work to support the planning and development of iron mines. In December 2019, the Company reported the results of an updated NI 43-101 compliant Preliminary Economic Assessment at Hopes Advance [link to report].
Hopes Advance Project: 2019 PEA
Overview
In December 2019, the Company reported the results of an updated NI 43-101 compliant Preliminary Economic Assessment at Hopes Advance prepared by BBA Engineering Ltd. (“BBA”) in respect of the Company’s Hopes Advance Project (the “Project”).
A Pre-Feasibility Study was completed on the Project in 2012 (“2012 PFS”). The Company is not treating the economic results of the 2012 PFS or the related Mineral Reserve estimates as current. However, some of the scientific and technical information generated during the 2012 PFS is used as a basis for the Study.
The objective of the PEA was to rescope the Project profile and production scale using Measured and Indicated Mineral Resources estimated within three of the 10 defined deposits in order to reduce the up-front capital required to bring the Project to commercial production. Mineral Resources that are not Mineral Reserves do not have demonstrated economic viability.
Key differences in this Study compared to the 2012 PFS include the following:
- Significantly lower initial capital expenditure
- Reduced production scale to accommodate the aforementioned lower capital expenditure
- Seasonal shipping of concentrate versus year-round shipping in the 2012 PFS, reducing Port infrastructure capital costs and eliminating winter shipping risks
- Construction of a more cost-effective module based barge-mounted power plant versus a land based plant and reliance on Hydro Quebec connections in the 2012 PFS. Although the Company is not reliant on third party infrastructure, there exists the potential for future power operating cost savings in the event a transmission line connection is established with Hydro Québec
- Base case FOB selling price of USD $82/t, versus US $100/t in the 2012 PFS
- The assumed exchange rate used in the current Study was US $0.75 = CAD$1.00, versus a US $1.00 = CAD $1.00 exchange rate in the 2012 PFS
Table 1 – Summary Results of the Study
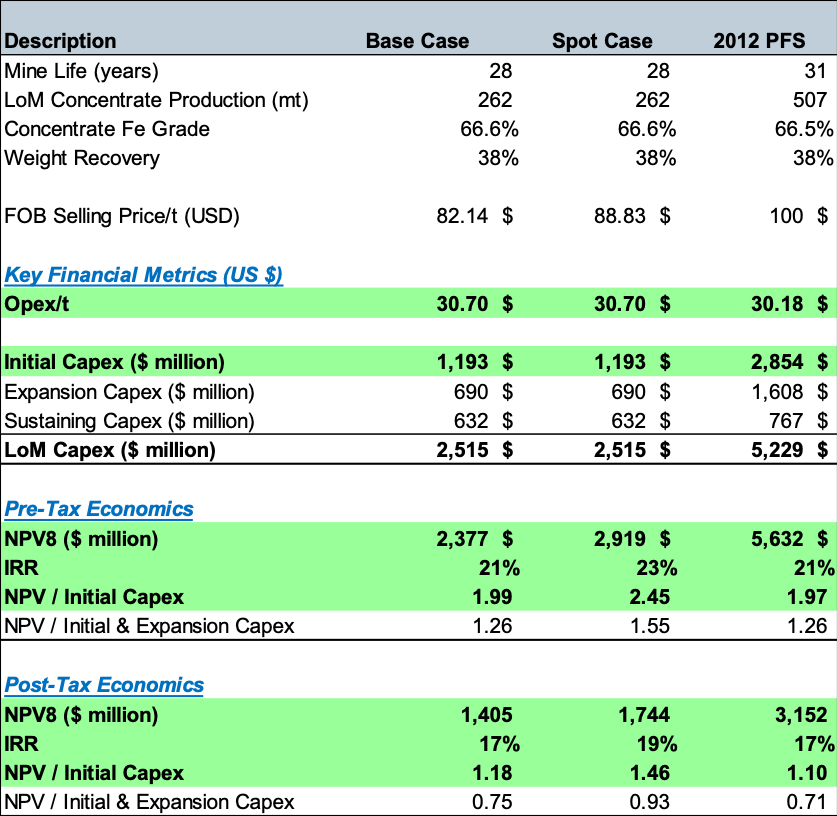
* Numbers may not add up due to rounding.
The results of the Study attribute significant value to the Project and present a significant reduction in initial capital expenditure requirements, all while achieving the same post tax IRR as the 2012 PFS. Importantly, the Project achieves an NPV / Initial Capex Ratio of 1.18, which is rare for bulk/base metal projects where capital requirements are typically very high.
Additional Attributes of the Project:
- Project implementation and development schedule independent of third-party infrastructure, including extension to the Hydro Québec grid north to the Project
- Construction and operations to utilize barge-mounted self-generated power;
- Low operating cost per tonne resulting from “no rail” advantage, simple metallurgy and low strip ratio (0.81:1 over life of mine)
- Pilot plant metallurgical test work conducted as part of the 2012 PFS, confirms product quality suitable for pellet or sinter feed
- 66.6% Fe grade concentrate with low deleterious elements and silica content ≤ 4.5%
- High weight and Fe recoveries using a relatively simple flow sheet
- Construction of a marine facility in Hopes Advance Bay at Pointe Breakwater
The Study
The Study was led by the Montreal office of BBA, a Canadian consulting engineering firm with over 900 employees, who have extensive experience with iron ore projects, particularly in the Labrador Trough. Working alongside BBA was Wood (formerly, AMEC Foster Wheeler), who worked with the Company on Port related infrastructure in the Company’s previous studies.
The Company presents two cases as part of the Study with the only variable between the cases being the FOB selling price. The Base Case assumes an FOB selling price of approximately USD $82/t (approximately US $105/t CFR). The alternate case presents the economics of the Project using a spot price of approximately USD $89/t FOB (November 22nd 2019).
In both cases, the Study is based on initial production of approximately 5 million tonnes per annum of dry concentrate followed by an expansion in year 5 to approximately 10 million tonnes per annum. The financial analysis for the Study is limited to a 28-year mine life and considers only 3 of the 10 deposits for which mineral resources have been estimated. The Company believes that the remaining resources could support continued operations well beyond 28 years. The 28‑year mine plan for the Study is based on mining the Castle Mountain, Iron Valley and Bay Zone F deposits whereas the 2012 PFS considered mining all 10 of the Hopes Advance deposits at an initial concentrate production rate of 10 Mtpa with an expansion to 20 Mtpa in year 11 over a 30 year mine life. For both initial and expansion phases of the Study, power is self-generated using diesel fuel. Concentrate is filtered at the concentrator site and transported year-round by truck to a port stockpile where it is shipped only during summer months (under the 2012 PFS, concentrate in a slurry state was pumped to the port and re-dried. The rescoped approach eliminates costs related to regrinding and drying the concentrate at the port). Such seasonal shipping results in reduced port installation costs and the avoidance of having to use higher cost ice class vessels during the winter. For the Study, BBA is proposing a modified process flowsheet which is more energy efficient, aimed at reducing power requirements (and fuel storage) and expected to improve the Project’s carbon footprint compared to the initial phase in the 2012 PFS which required significantly more electric power which was generated using heavy fuel oil.
Updated Value in Use Study Reaffirms Product Desirability of Hopes Advance Product
In 2013, the Company commissioned and received a Product Value in Use Marketing Study (“2013 VIU Study”) from Vulcantech Technologies. The 2013 VIU Study concluded that, in addition to the iron unit premium for the high grade Hopes Advance product at 66.6% Fe measured against the 62% Fe benchmark, the low impurities associated with the Hopes Advance product could attract an additional quality premium for steel producers in China, Korea, Japan, and Taiwan.
In 2019, the Company commissioned Vulcantech Technologies to update its VIU study (the “2019 VIU Study”) in order to obtain current market data as to the potential pricing and demand for Hopes Advance Iron Ore.
The 2019 VIU Study concludes that:
- Recent environmental restrictions placed by Chinese Central and Provincial Governments are likely to lead to more support for higher grade iron ores as steel mills try to maximize steel production and minimize pollution, driven by chemical inputs used in removing deleterious elements from iron ore
- 65% Fe index ores are expected to obtain a 15-30% premium per Fe unit over the 62% Fe benchmark prices
- The quality premium over and above the 65% Fe index ores has been reduced to approximately 5%
- Due to the above, improved pricing compared to the base case pricing used for the Study would be expected given the low phosphorus and alumina content of the Hopes Advance material
- While the 2019 VIU Study focuses on Chinese demand, steel producers in China, Korea, Japan, Taiwan and Europe could still benefit considerably from the product’s low impurity chemistry.
Hopes Advance’s Competitive Cost Profile Compared to Industry Producers*
The Base Case FOB Price of US $82.14 and shipping costs of US $22.83/t (to Qingdao, China), results in a CFR price of US $104.97/t. In comparing the Hopes Advance product economics to that of producers, it is important to factor in the premium applied in the pricing of the Hopes Advance product to other iron ore products. By way of example, by using the implied premium of the Hopes Advance product to product from the Pilbara region of Australia as a reduction or credit to the operating cost at Hopes Advance, a more meaningful and appropriate operating cost comparison per tonne of product shipped is achieved. As per Table 2 below, the net effective operating costs at Hopes Advance are arguably very competitive to Pilbara blends, the largest source of seaborne iron ore.
Table 2 – Calculation of Net Effective Operating Cost at Hopes Advance versus the Pilbara Fines
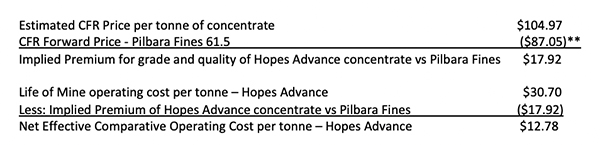
*This section is based on analysis by the Company and is not contained in the technical report for the Study
**Source – BAIINFO Iron Ore Daily, Issue 19-227, December 4, 2019
Metallurgical Testwork and Process Flowsheet
Metallurgical testwork consisted of bench scale tests as well as a pilot test program. Generally, the results of the testwork indicated the following characteristics for the mineralized material tested:
- It is relatively soft
- It can be processed with a simple and conventional flow sheet
- A concentrate with low SiO2 and low deleterious elements can be produced
The conceptual flowsheet and plant design proposed in the Study are based on the following:
- Testwork performed during the 2012 PFS.
- A comminution circuit based on HPGR grinding technology.
- The use of a three-stage spiral circuit for gravity concentration, as in the 2012 PFS.
- A scaled version of the magnetic concentrator plant from the 2012 PFS, substituting the Ball Mill with more energy efficient Verti-Mills.
- Flowsheet improvements, plant design and general layouts based on BBA’s experience on other similar projects.
- Concentrate trucking to the port removing the requirement of regrinding the hematite concentrate and construction of a pipeline.
A simplified mineral processing flowsheet is shown in Figures 1 and 2.
Figure 1: Simplified flowsheet for comminution and spiral circuits
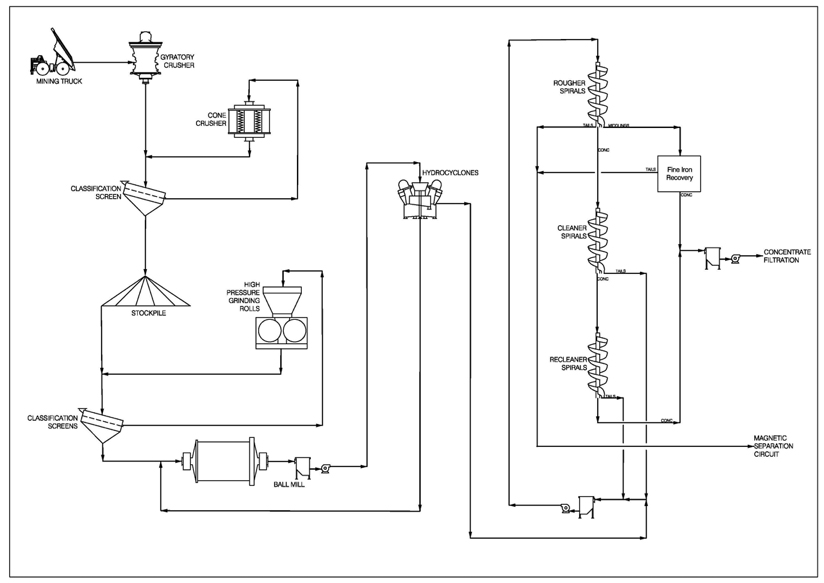

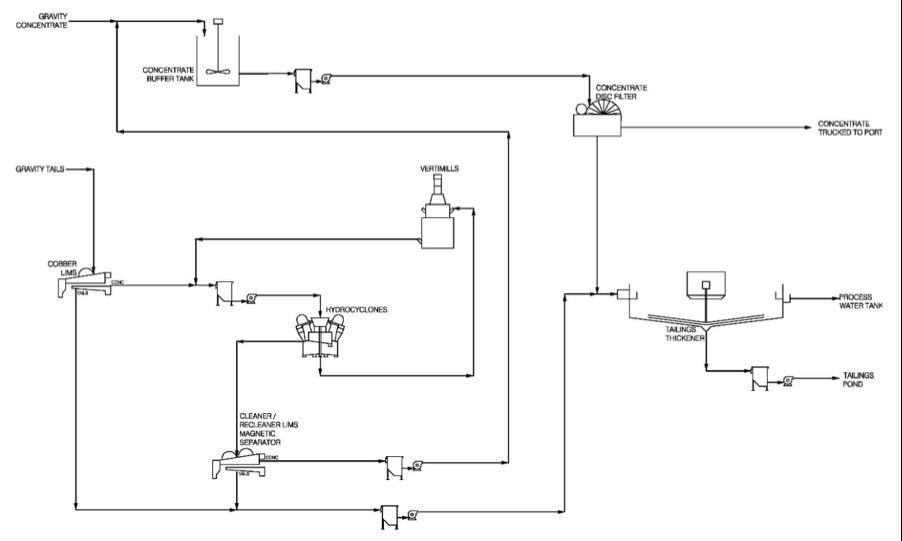
Figure 2: Simplified flowsheet for magnetic separation, regrind and dewatering circuits

A description of the proposed process is set out below:
- Run of mine mill feed material is crushed in two stages prior to being stockpiled;
- Crushed mill feed material will be is reclaimed and undergoes a size reduction to a P80 of 140µm via HPGR and ball milling;
- The material is then pumped to a gravity recovery circuit which produces a final hematite concentrate and a gravity tail;
- The gravity tails are pumped to magnetic separation wherein the magnetic portion is recovered and sent to filtration along with the hematite concentrate;
- The tailings from magnetic separation are thickened and pumped to a tailings pond;
- The filtered concentrate is stockpiled to be loaded year-round into trucks which transport the concentrate to a stock yard where a stacker-reclaimer system will place the material into a storage stockpile to be shipped during the summer season;
Mineral Resource Estimate
The Hopes Advance iron deposits comprise a total of 10 mineral deposits. These deposits are a typical stratigraphic iron deposit similar to other Labrador Trough iron deposits of Lake Superior-type iron formations, located at the northern end of the Labrador Trough.
The Hopes Advance iron formations are thick Sokoman Iron Formation, with magnetite, magnetite and hematite units that strike east-west to northeast and have gentle dips to the south and southeast. The iron formations are typically 40–70 m thick, and often crop out at surface. The three largest deposits are the Castle Mountain, Bay Zone F and Iron Valley deposits.
Mineral Resources that were estimated assuming open pit mining methods in 2012 were reviewed in 2019 to determine if they were still current. These reviews included checks on the confidence classification assignments based on changes to defined terms between the 2010 and 2014 editions of the Canadian Institute of Mining, Metallurgy and Petroleum (CIM) Definition Standards for Mineral Resources and Mineral Reserves, inputs into the Whittle optimisation shells that constrain the estimate, and commodity price assumptions as a result of the 2019 VIU Study. Eddy Canova, P. Geo, a consultant to the Company concluded that the estimates remain current, and have an effective date of 20 November, 2019, which is the date the reviews were completed.
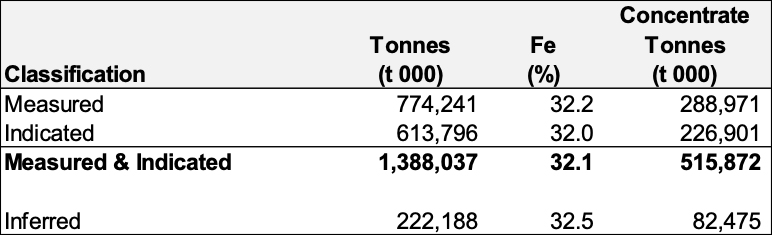
Mineral Resources were estimated for the Bay Zone B, C, D, E, F, Castle Mountain, Iron Valley, West Zone 2, West Zone 4 and West Macdonald deposits, and are totalled in Table 3.
Table 3 –Mineral Resource Estimate Hopes Advance (25% Fe Cut-off)
Notes:
- The Qualified Person responsible for the estimates (including the current Mineral Resource estimates) is Mr. Eddy Canova, P. Geo, a consultant to the Company.
- Mineral Resources are reported assuming open pit mining methods. Mineral Resources were initially reported with an effective date of 19 September 2012, on a block model that had an effective date of 2 April 2012. A review was undertaken in 2019, which concluded that the estimate and its inputs were current, and the effective date for the reviewed estimate is 20 November, 2019. The Mineral Resource is now current as at November 20, 2019
- Mineral Resources are classified using the 2014 CIM Definition Standards. Mineral Resources are not Mineral Reserves and do not have demonstrated economic viability.
- The Mineral Resources were estimated using a block model with parent blocks of 50 m by 50 m by 15 m sub-blocked to a minimum size of 25 m by 25 m by 1m and using inverse distance weighting to the third power (ID3) methods for grade estimation. A total of 10 individual mineralized domains were identified and each estimated into a separate block model. Given the continuity of the iron assay values, no top cuts were applied. All resources are reported using an iron cut-off grade of 25% within conceptual Whittle pit shells and a mining recovery of 100%. The Whittle shells used the following input parameters: commodity price of USD $115/dmt of concentrate; C$:US$ exchange rate of 0.97; assumed overall pit slope angle of 50º; 1% royalty; mining cost of CAD $2.00/t material moved; process cost of CAD $16.22/t of concentrate; port costs of CAD $1.45/t of concentrate; and general and administrative costs of CAD $3.38/t of concentrate.
- Estimates have been rounded and may result in summation differences.
Mine Plan
The proposed mining method selected for the Project consists of a conventional open pit, truck and shovel, drill and blast operation. The mineralized material and waste rock will be mined with 10 m high benches, drilled, blasted and loaded into a fleet of 292 t capacity haul trucks with diesel hydraulic shovels. The mineralized material will be hauled to the primary crushing facility and the waste rock will be hauled to either the waste rock piles or to the tailings facility to be used as construction material.
Even though the Hopes Advance Bay Mineral Resources are contained within ten (10) distinct deposits, the Study is limited to the Castle Mountain, Iron Valley, and Bay Zone F deposits. These three deposits provide sufficient material to sustain the first 28 years of operation at the production rate considered in the Study. Each of these deposits has favorable economics (higher grade and lower strip ratios than the other deposits) and they are also the three largest resource bases of the ten deposits. Only mineral resources classified as Measured and Indicated are considered in the mine plan as potential mill feed.
Table 4 below presents the subset of the Mineral Resources that are contained within the open pit designs that were used to develop the life of mine plan for the Study. The resource subset is reported above a cut-off grade of 25% Fe and includes mining dilution and mining losses which were estimated to be 1.5% and 5% respectively.
Table 4: Subset of Mineral Resources within the PEA mine plan (25% Fe Cut-Off Grade)
| Deposit | Measured Resources | Indicated Resources | Total Resources | Waste | Strip Ratio | ||||||
| Tonnes | Fe | WR | Tonnes | Fe | WR | Tonnes | Fe | WR | Tonnes | ||
| (Mt) | (%) | (%) | (Mt) | (%) | (%) | (Mt) | (%) | (%) | (Mt) | ||
| Castle Mountain | 266 | 32.6 | 38.0 | 107 | 32.6 | 38.0 | 372 | 32.6 | 38.0 | 317 | 0.85 |
| Iron Valley | 34 | 34.1 | 40.0 | 57 | 33.9 | 40.0 | 91 | 34.0 | 40.0 | 62 | 0.68 |
| Bay Zone F | 107 | 33.0 | 39.0 | 114 | 32.7 | 38.0 | 221 | 32.8 | 38.5 | 178 | 0.80 |
| Total | 406 | 32.8 | 38.4 | 278 | 32.9 | 38.4 | 684 | 32.9 | 38.4 | 557 | 0.81 |
Processing Plan
The Process design basis for both the initial and expansion phases of the Study is outlined in Table 5.
Table 5: Proposed process design basis
| Parameter | Unit** | Initial Phase* | Expansion Phase* |
|---|---|---|---|
| Total feed processing rate | Mtpa | 13.3 | 26.5 |
| Weight recovery (per project phase) | % | 39.1% | 38.2% |
| Weight recovery (LOM) | % | 38.4% | |
| Concentrate produced (Total) | Mtpa | 5.18 | 10.13 |
| Concentrate produced (gravity ~ 84%) | Mtpa | 4.35 | 8.51 |
| Concentrate produced (magnetic ~ 16%) | Mtpa | 0.83 | 1.62 |
| Final Concentrate Grade (%Fe , % SiO2) | % | 66.6% Fe, 4.50% SiO2 | |
| * Initial Phase from Yr 1 to Yr 4. Expansion Phase from Yr 5 to Yr 28. Excludes ramp-up years Yr 1 & Yr 5. ** All tonnages are in dry metric tonnes. |
|||
Site Infrastructure Conceptual Layout
The general site plot plan and main infrastructure features for the Project is based on the plan and layout developed during the 2012 PFS.Mining of the Castle Mountain, Iron Valley and Bay Zone F deposits only are considered for the Study. The other mineralized areas are left unencumbered in consideration of future mining.
- The crusher/concentrator area is maintained in the same general area identified in the 2012 PFS. The required footprint is adjusted to the 5 Mtpa initial plant with room provided for a parallel line for expansion to 10 Mtpa.
- Waste rock piles have been designed to store waste rock generated during the first 28 years of the mining operations at the prescribed mining rate of the Study.
- Tailings are pumped into the designated tailings storage facility, based on the deposition plan and TMF progressive design developed for the 2012 PFS. For the current PEA however, construction of the initial dikes, as well as the dikes that are progressively being constructed, have been adjusted to the estimated annual tailings volumes generated by the project at 5 Mtpa followed by an expansion to 10 Mtpa. Material for dike construction will be supplied by the mine.
- Filtered concentrate, at a nominal moisture of 8%, from the concentrator is discharged onto a stockpile where it is loaded into haul trucks using loaders. The trucks transport the concentrate to the port area concentrate stockpile year-round.
- A 26 km access road will connect the port to the mine to be used for concentrate transport and delivery of consumables and cargo to the mine.
- Other infrastructure includes a permanent 400 person modular camp at the mine and 25 person camp at the port, the rehabilitation of an existing airstrip, and service buildings including mine equipment garage facilities and warehouses and fuel storage tank farm.
- At the port, concentrate is stacked and reclaimed using a common conveyor belt that discharges onto the shiploading conveyor. Stacking is performed year-round, whereas reclaiming is seasonal. During the summer shipping season, concentrate is reclaimed using a bucket reclaimer. A location for an identical stockpile and conveying system is proposed for the expansion to 10 Mtpa.
- The Project marine facilities are planned to be fully developed for the initial phase in order to handle the ultimate concentrate production rate of 10 Mtpa (dry basis). In addition to concentrate shipment, the marine facilities will accommodate shipments of various cargoes as required for the mine and the concentrator operation. The conceptual design of the marine facilities, including the shiploading system was developed by Wood.
- The Project iron ore berth is designed to accommodate bulk carriers ranging from 70,000 DWT to 240,000 DWT. For general cargo shipment, vessels ranging from 10,000 DWT to 45,000 DWT were assumed for the purpose of the wharf design. The design considers that marine activities will be seasonal with operations taking place only during the ice-free season, assumed to last 110 days.
- The power plant is a prefabricated, barge system that is beached and bermed at the port and includes a 120 kV substation. The initial capacity is 48 MW plus 19 MW stand-by. An additional 29 MW will be added for the expansion. A 26 km overhead transmission line will be installed to deliver power from the power plant to the mine site.
Roberts Lake Area
The Roberts Lake area was first discovered in 1952 with active exploration commencing that same year and continuing through 1957. During this period of exploration work focused on the Kayak Bay deposit and consisted of surface mapping, channel sampling, exploration drilling (46 holes), and metallurgical testing. Additional work was completed during 1972 with a geophysical survey of the area and in the 1990's with additional metallurgical testing. Exploration work completed on the property includes exploration drilling, surface sampling, surface mapping, and metallurgical test work. At the Kayak Bay deposit, a preliminary pit was laid out to develop the drill indicated resource.
Exploration and drilling was also carried out in the Payne River zone (26 holes), Igloo Lake zone (11 holes), Hump zone (15 hole), and Roberts Lake zone. The iron formation can be traced along both limbs of the syncline. An extension to the northwest of the syncline was also identified and is the location of the Armand Lake zone.
A total of 97 drillholes were completed in the Roberts Lake area totalling 5,115 m.1. Roberts Lake - Historic Resource*
|
Deposit |
Crude Resource (million metric tonnes) |
Head Iron (Sol. Fe) |
Exploration Drillholes |
Metres Drilled |
Source |
Date |
|
Kayak Bay Zone (Zone 1) |
111.7 |
35.3% |
45 |
1,880 |
P.E. Cavanagh |
1970 |
|
Payne River (Zone 2) |
22.3 |
31.0% |
26 |
2,535 |
P.E. Cavanagh |
1970 |
|
Igloo Lake (Zone 3) |
101.6 |
38.0% |
11 |
248 |
P.E. Cavanagh |
1970 |
|
Hump (Zone 4) |
203.2 |
37.6% |
15 |
452 |
P.E. Cavanagh |
1970 |
|
Total Drill Indicated |
438.8 |
36.8% |
97 |
5,115 |
--- |
--- |
|
|
|
|
|
|
|
|
|
Synclinal (Zone 5) |
203.2 |
36.0% |
0 |
0 |
P.E. Cavanagh |
1970 |
|
Yvon Lake (Zone 6) |
101.6 |
36.8% |
0 |
0 |
P.E. Cavanagh |
1970 |
|
Potential Zone 1 |
254.0 |
35.0% |
0 |
0 |
P.E. Cavanagh |
1970 |
|
Potential Zone 2 |
254.0 |
35.0% |
0 |
0 |
P.E. Cavanagh |
1970 |
|
Total Potential |
812.8 |
35.5% |
0 |
0 |
--- |
--- |
|
|
|
|
|
|
|
|
|
Total Roberts Lake Area |
1,251.6 |
35.9% |
97 |
5,115 |
--- |
--- |
*These are historical resource estimates that do not comply with the current Canadian Institute of Mining, Metallurgy and Petroleum Resources (CIM) Definition Standards on Mineral Resources and Mineral Reserves as required by National Instrument 43-101 (NI 43-101) Standards of Disclosure for Mineral Projects. These historical resource estimates were described as "drill indicated" and "potential" at the time of reporting which does not correspond to the categorization set forth in sections 1.2 and 1.3 of NI 43-101. Although these historical resource estimates are relevant to support the presence of large areas of iron mineralization, these estimates are speculative, are based on very limited exploration drilling and will require extensive new exploration and metallurgical efforts to validate. They should not be treated as current mineral resources or reserves or relied upon until confirmed by current exploration and a Qualified Person. A Qualified Person has not done sufficient work to upgrade or classify these historical resource estimates as current NI-43-101 compliant mineral resources. The Roberts Lake historic resource was reported in 1970 from drilling in the late 1950s, the Morgan Lake historic resource was reported in 1957 and 1964, and the Hopes Advance historic resource was reported in 1958. Further information in respect of these historic resources is outlined in a 43-101 technical report prepared by Micon entitled "Technical Report on the Ungava Iron Property - Ungava Bay Region, Quebec, Canada" dated Oct. 29, 2010, available on SEDAR and on this website.
Morgan Lake Area
The Morgan Lake area iron deposits were first discovered in 1953 with active exploration commencing in 1955 and continuing through 1957. Exploration work completed on the property includes exploration drilling, surface sampling, surface mapping, and metallurgical test work. Detailed site layouts were completed for a processing plant and harbour near the Payne Range iron deposits.
Drilling was completed on the Payne Range (29 holes) and Morgan Lake deposits (16 holes). Exploration was also conducted in the Black Payne South, Harnden Range, Esson Lake, and McOuat Range zones
A total of 45 drillholes were completed in the Morgan Lake area totalling 3,611 m.2. Morgan Lake – Historic Resource*
|
Deposit
|
Crude Resource (million metric tonnes)
|
Head Iron (Mag. Fe)
|
Exploration Drillholes
|
Metres Drilled
|
Source
|
Date
|
|
Payne Range
|
72.4
|
23.9%
|
29
|
1,427
|
G.A. Gross
|
1964
|
|
Morgan Lake
|
437.8
|
21.8%
|
16
|
2,184
|
A.T. Griffis
|
1957
|
|
Total Drill Indicated
|
510.2
|
22.1%
|
45
|
3,611
|
---
|
---
|
|
|
|
|
|
|
|
|
|
Morgan Lake Potential
|
101.6
|
22.7%
|
0
|
0
|
A.T. Griffis
|
|
|
|
|
|
|
|
|
|
|
Total Morgan Lake Area
|
611.8
|
22.2%
|
45
|
3,611
|
---
|
---
|
*These are historical resource estimates that do not comply with the current Canadian Institute of Mining, Metallurgy and Petroleum Resources (CIM) Definition Standards on Mineral Resources and Mineral Reserves as required by National Instrument 43-101 (NI 43-101) Standards of Disclosure for Mineral Projects. These historical resource estimates were described as "drill indicated" and "potential" at the time of reporting which does not correspond to the categorization set forth in sections 1.2 and 1.3 of NI 43-101. Although these historical resource estimates are relevant to support the presence of large areas of iron mineralization, these estimates are speculative, are based on very limited exploration drilling and will require extensive new exploration and metallurgical efforts to validate. They should not be treated as current mineral resources or reserves or relied upon until confirmed by current exploration and a Qualified Person. A Qualified Person has not done sufficient work to upgrade or classify these historical resource estimates as current NI-43-101 compliant mineral resources. The Roberts Lake historic resource was reported in 1970 from drilling in the late 1950s, the Morgan Lake historic resource was reported in 1957 and 1964, and the Hopes Advance historic resource was reported in 1958. Further information in respect of these historic resources is outlined in a 43-101 technical report prepared by Micon entitled "Technical Report on the Ungava Iron Property - Ungava Bay Region, Quebec, Canada" dated Oct. 29, 2010, available on SEDAR and on this website.
Eddy Canova, P.Geo., OGQ(403), the Director of Exploration for the Company and a Qualified Person as defined by NI 43-101, has reviewed and is responsible for the technical information contained on this website..